Mapping Ecosystems for Data-Powered Innovation
This month, Michaela Bonnett from the OSB team presented our Ecosystem Dashboard tool at the Census Open Innovation Summit! Over the course of a 12-week sprint facilitated by the National League of Cities and The Opportunity Project by the US Census Open Innovation Labs (COIL), the OSB team developed the Ecosystem Dashboard tool to support local innovators in building robust, interconnected innovation networks.
Watch Michaela’s demo of our Ecosystem Dashboard in the clip above.
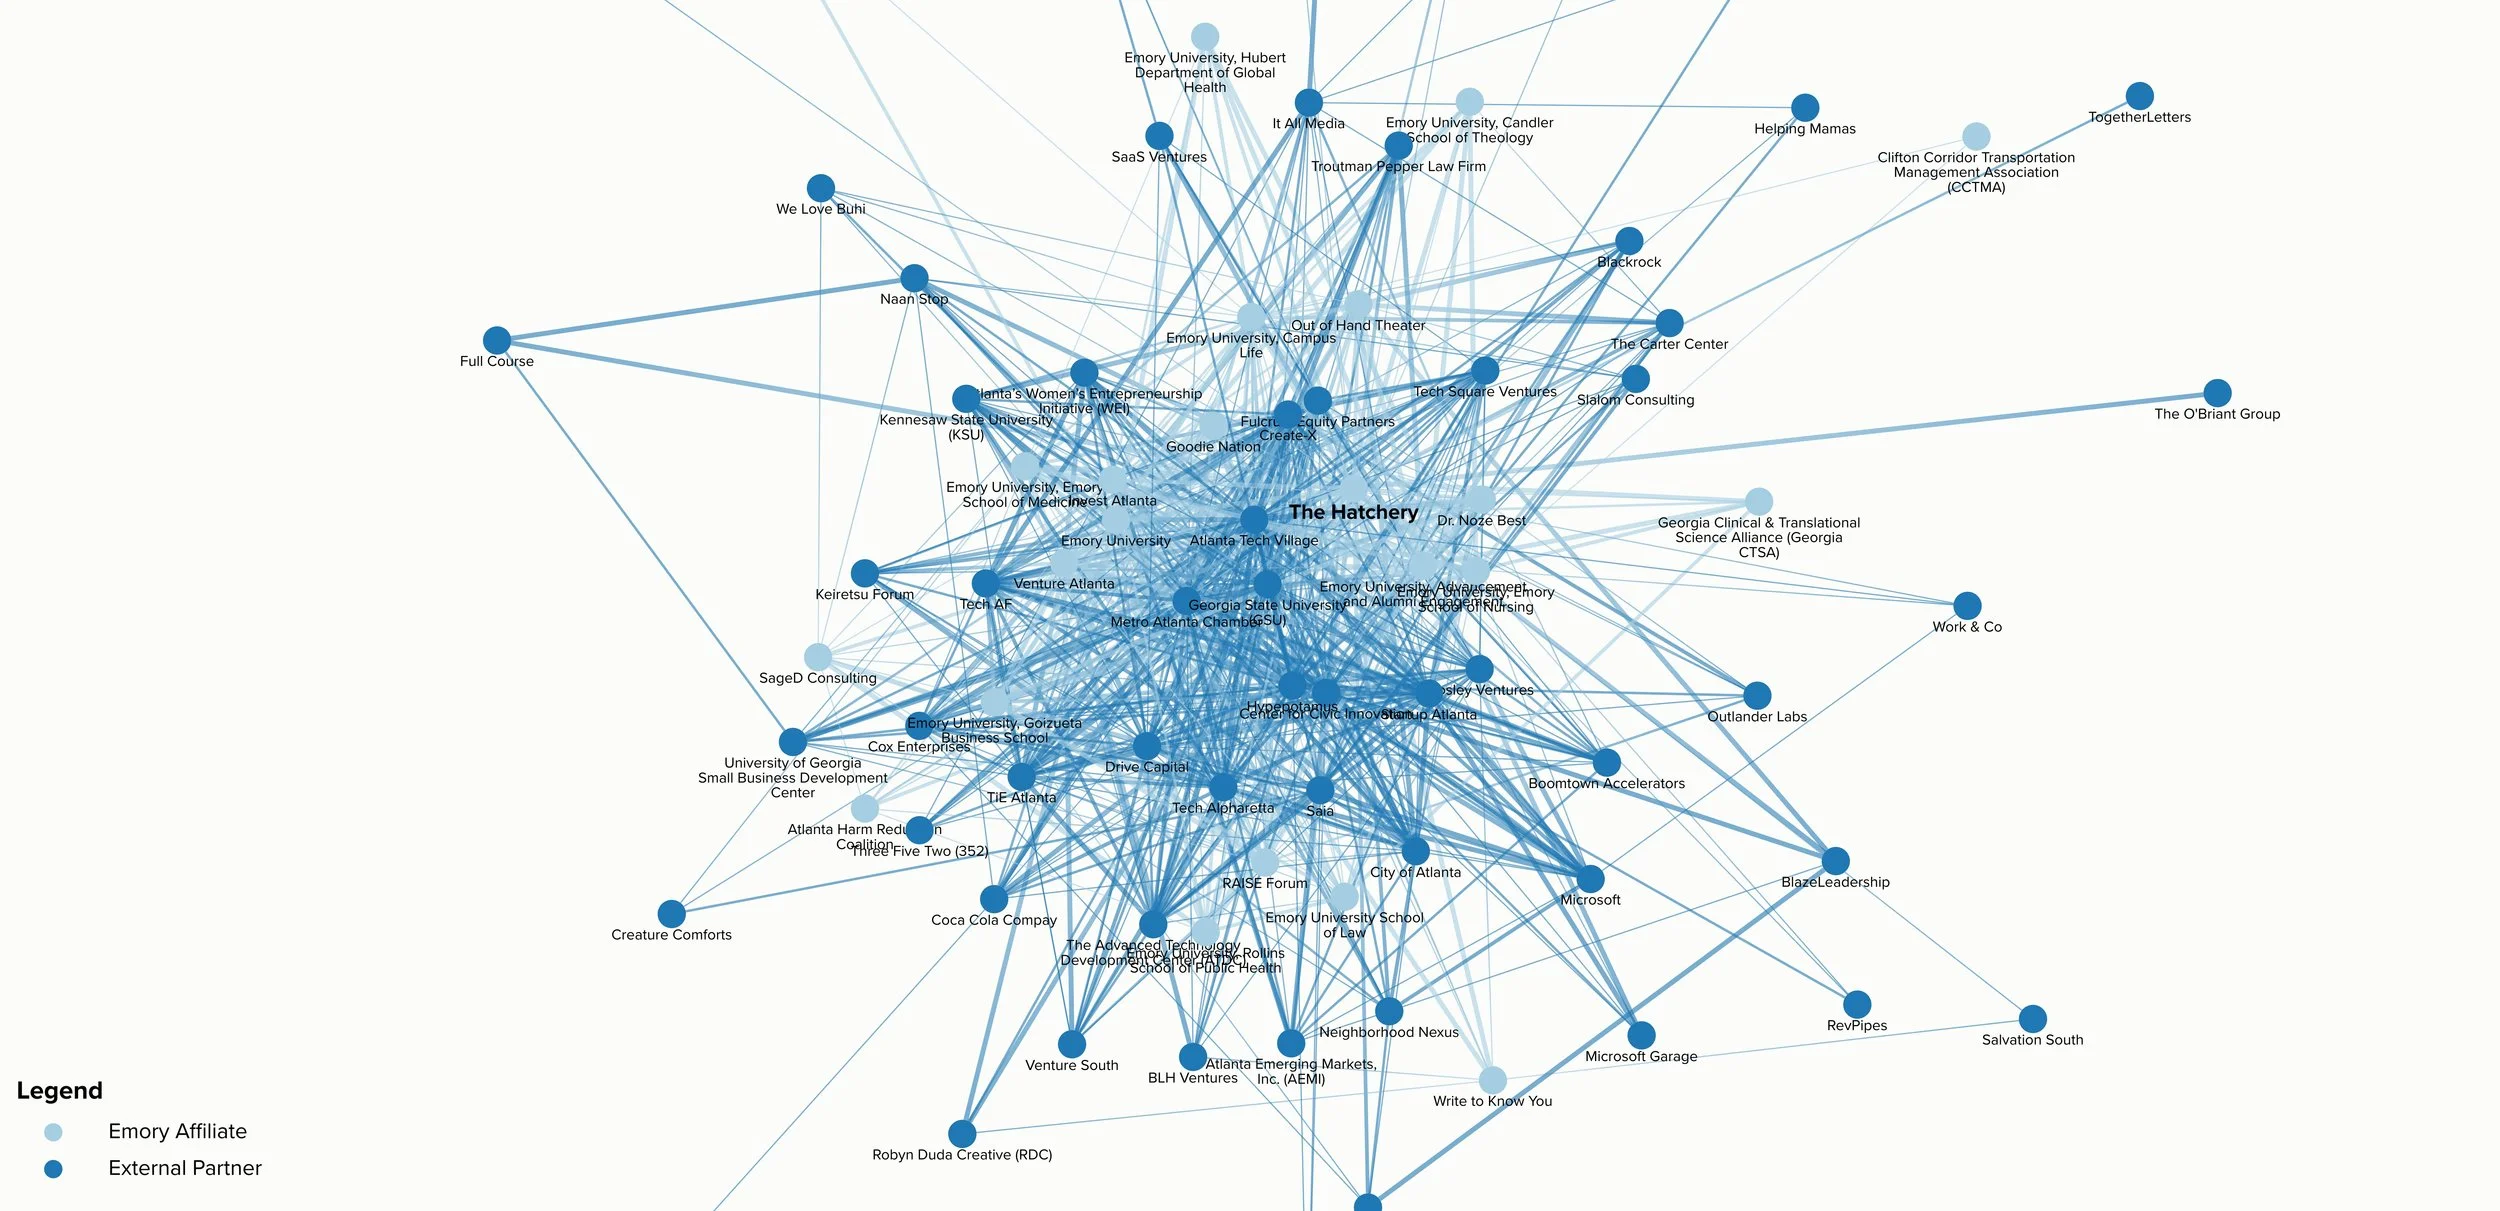
Our Ecosystem Dashboard showcases the rich insights that can be derived from social network analysis as applied to innovation ecosystems.
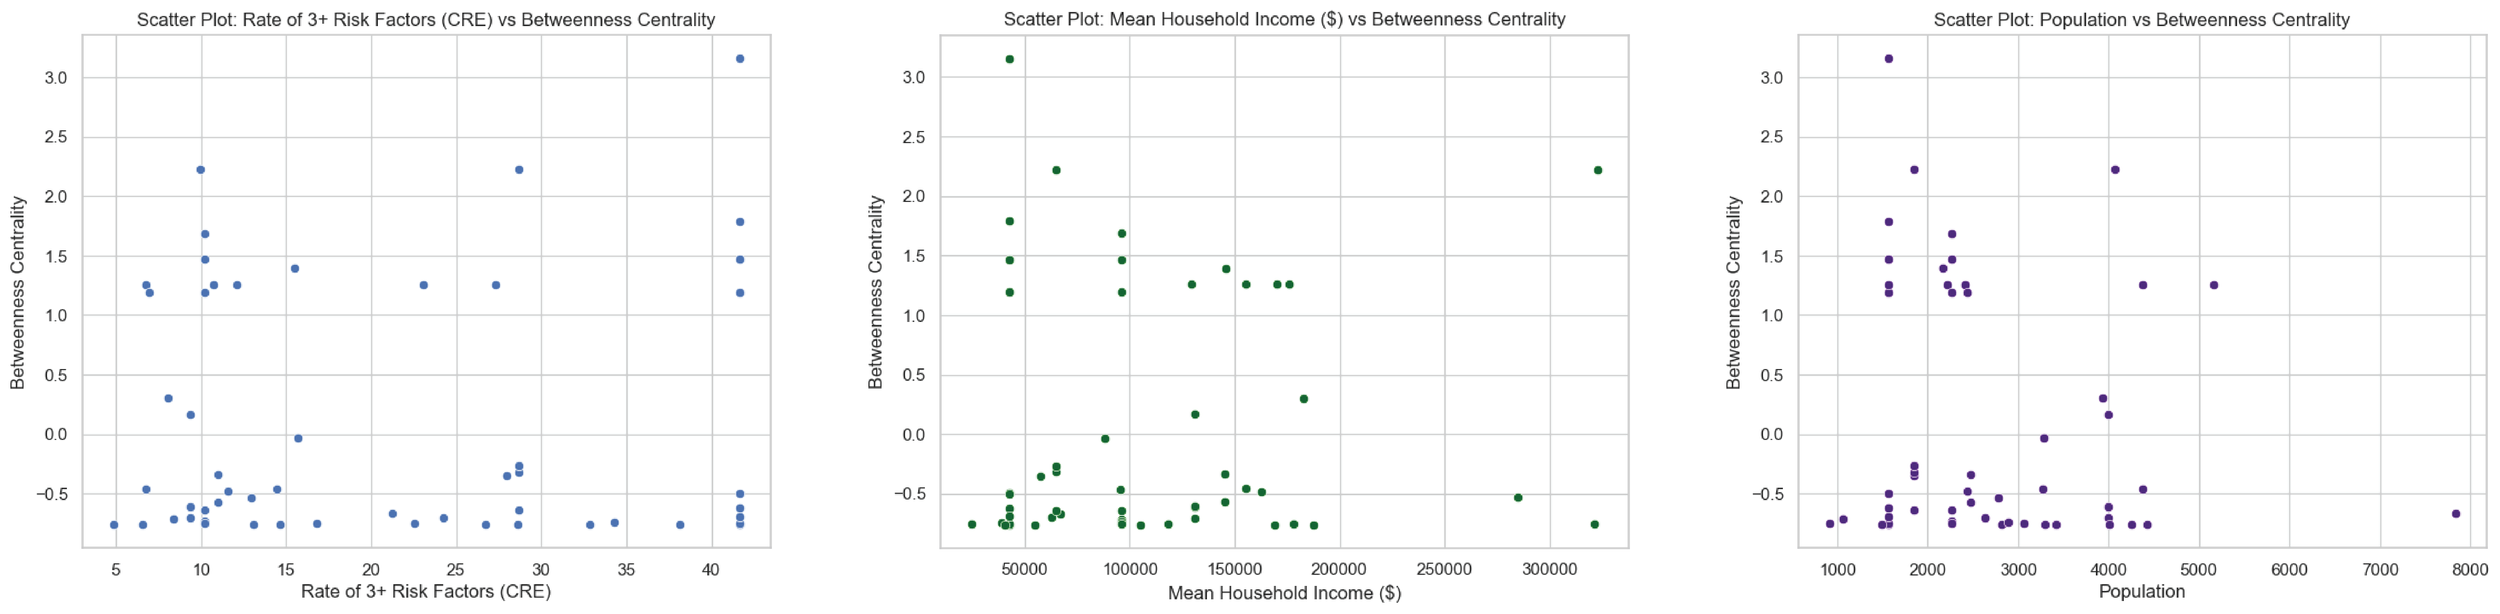
Our Ecosystem Dashboard allows viewers to explore social network analysis data through several formats; an overall network map, stacked bar charts showing overall connectivity of each organization, and connectivity data imposed onto geographic maps alongside open-source Census data. Our dashboard also highlights network analysis metrics correlations with open-source Census data sets; such as betweenness centrality and household income, or proportion of individual risk factors in the geographic area.
To help viewers interpret the graphs and to make the data actionable to ecosystem stakeholders, each feature on the dashboard is accompanied by insights and recommendations based on the data findings. These insights especially make OSB’s Ecosystem Dashboard an exceptional resource for those looking to create impactful, data-backed interventions.
We’re so proud of our team for what we’ve accomplished over the past 12 weeks of the TOP NLC Sprint, and can’t wait to see how the methods we’ve refined over the course of the sprint can be further developed and applied!
Written by Amy Qu, Innovation Strategist